FastAPI is fast. That's the promise. Starlette underneath, Uvicorn on top, async all the way down. And for most simple endpoints it delivers.
Then your API hits production, someone adds a "quick" data transformation, a colleague nests some ORM calls inside a loop, and suddenly your 50ms endpoint takes 4 seconds. Your monitoring dashboard lights up. Users complain. And you're staring at perfectly functional code with no idea where the time goes.
This is where py-spy earns its keep.
Why Not Just Use cProfile?
Python ships with cProfile. It works. But it's a tracing profiler — it instruments every function call and return, measures the time between them, and reports the results. For a FastAPI application, this creates two problems.
First, the overhead is significant. cProfile hooks into every function call, which means your profiled application behaves differently from your real application. The profiler itself becomes a bottleneck, and the results can mislead you about where the actual problem lies.
Second, cProfile and async code don't mix well. FastAPI is built on asyncio. An async function gets "entered" and "exited" by the event loop at every await clause. cProfile sees each re-entry as a separate function call, inflating call counts and making the output confusing. If your endpoint awaits a database query, then does some processing, then awaits another query — cProfile will report it as three separate invocations of the same function.
py-spy takes a fundamentally different approach.
What py-spy Actually Does
py-spy is a sampling profiler written in Rust. It runs as a completely separate process and reads the target Python process's memory directly — using process_vm_readv on Linux, vm_read on macOS, and ReadProcessMemory on Windows. It takes snapshots of the call stack at a configurable frequency (default 100 times per second) and aggregates those samples into a statistical picture of where your program spends its time.
The key advantages for profiling a FastAPI application:
- Zero code changes. You don't add middleware, decorators, or import statements. You attach to a running process or launch one.
- Minimal overhead. Because it samples from outside the process, it doesn't slow down your application in any meaningful way.
- Production-safe. You can attach it to a running uvicorn worker with
--nonblockingand profile real traffic without impacting users. - Subprocess support. The
--subprocessesflag profiles uvicorn worker pools and gunicorn workers, which is how most production FastAPI deployments actually run.
The Setup: A FastAPI App with a Hidden Problem
Let's build a realistic example. We have a FastAPI application that serves property listings — the kind of thing you might find in a B&B booking platform. Each listing has amenities, and we need an endpoint that returns listings with computed similarity scores.
Here's our initial implementation:
# app.py
import math
import json
from fastapi import FastAPI, Query
from pydantic import BaseModel

app = FastAPI()

# Simulated database of property listings
LISTINGS = []
for i in range(5000):
    LISTINGS.append({
        "id": i,
        "name": f"Property {i}",
        "price_per_night": 50 + (i % 200),
        "latitude": 54.5 + (i % 100) * 0.01,
        "longitude": -7.3 + (i % 100) * 0.01,
        "amenities": ["wifi", "parking", "kitchen", "heating", "tv",
                       "washer", "dryer", "iron"][: (i % 8) + 1],
        "rating": round(3.0 + (i % 20) * 0.1, 1),
        "reviews": i % 50,
    })


class ListingResult(BaseModel):
    id: int
    name: str
    price_per_night: int
    similarity_score: float
    distance_km: float


def haversine(lat1: float, lon1: float, lat2: float, lon2: float) -> float:
    """Calculate distance between two points using the Haversine formula."""
    lat1_rad = math.radians(lat1)
    lon1_rad = math.radians(lon1)
    lat2_rad = math.radians(lat2)
    lon2_rad = math.radians(lon2)

    dlat = lat2_rad - lat1_rad
    dlon = lon2_rad - lon1_rad

    a = math.sin(dlat / 2) ** 2 + \
        math.cos(lat1_rad) * math.cos(lat2_rad) * math.sin(dlon / 2) ** 2
    return 6371 * 2 * math.asin(math.sqrt(a))


def compute_similarity(listing: dict, preferences: dict) -> float:
    """Compute a similarity score between a listing and user preferences."""
    score = 0.0

    # Price similarity (closer to target = higher score)
    price_diff = abs(listing["price_per_night"] - preferences["target_price"])
    score += max(0, 100 - price_diff) / 100

    # Amenity overlap — this is deliberately inefficient
    requested = preferences.get("amenities", [])
    for amenity in requested:
        for listing_amenity in listing["amenities"]:
            if amenity.lower().strip() == listing_amenity.lower().strip():
                score += 1.0

    # Rating bonus
    score += listing["rating"] / 5.0

    # Review count bonus (log scale)
    if listing["reviews"] > 0:
        score += math.log(listing["reviews"]) / 10

    # Serialise and deserialise to "validate" the score — a real antipattern
    validated = json.loads(json.dumps({"score": score}))
    return validated["score"]


@app.get("/listings/search")
def search_listings(
    lat: float = Query(54.55),
    lon: float = Query(-7.28),
    target_price: int = Query(100),
    amenities: str = Query("wifi,parking,kitchen"),
    max_results: int = Query(20),
):
    preferences = {
        "target_price": target_price,
        "amenities": amenities.split(","),
    }

    results = []
    for listing in LISTINGS:
        distance = haversine(lat, lon, listing["latitude"], listing["longitude"])
        similarity = compute_similarity(listing, preferences)
        results.append({
            "id": listing["id"],
            "name": listing["name"],
            "price_per_night": listing["price_per_night"],
            "similarity_score": round(similarity, 3),
            "distance_km": round(distance, 2),
        })

    # Sort by similarity descending
    results.sort(key=lambda x: x["similarity_score"], reverse=True)

    return results[:max_results]
This works. Hit the endpoint and you get a sorted list of property listings. But it's slow, and we're about to find out exactly why.
Setting Up the Project
Initialise the project with uv and add the dependencies:
uv init fastapi-profiling-demo
cd fastapi-profiling-demo
uv add fastapi uvicorn
uv add --dev py-spyUnsupported version of Python error. Pin your project in pyproject.toml:
requires-python = ">=3.12, <3.14"uv python pin 3.13 && uv python install 3.13 && uv sync. Check the py-spy GitHub repository for the latest supported versions.
This gives us a clean virtual environment with FastAPI, Uvicorn, and py-spy as a dev-only dependency — it never ships to production.
Running and Profiling
Launch uvicorn under py-spy's supervision:
sudo uv run py-spy record -o profile.svg -- uvicorn app:app --host 0.0.0.0 --port 8000This runs everything within your project's virtual environment — py-spy launches uvicorn as a child process and immediately starts sampling. From a separate terminal, generate some load:
for i in $(seq 1 1000); do
    curl -s "http://localhost:8000/listings/search?amenities=wifi,parking,kitchen" > /dev/null
done
Press Ctrl+C when you're done. py-spy will write out profile.svg.
The py-spy Command Breakdown
py-spy record— run in recording mode, collecting samples over time.-o profile.svg— output as an interactive SVG flame graph. You can also use--format speedscopefor the Speedscope format, which some people prefer.-r 100— sample 100 times per second. The default, and usually sufficient.--duration 30— record for 30 seconds then stop.--subprocesses— include child worker processes. Essential if you're running gunicorn with multiple uvicorn workers.
The top Command
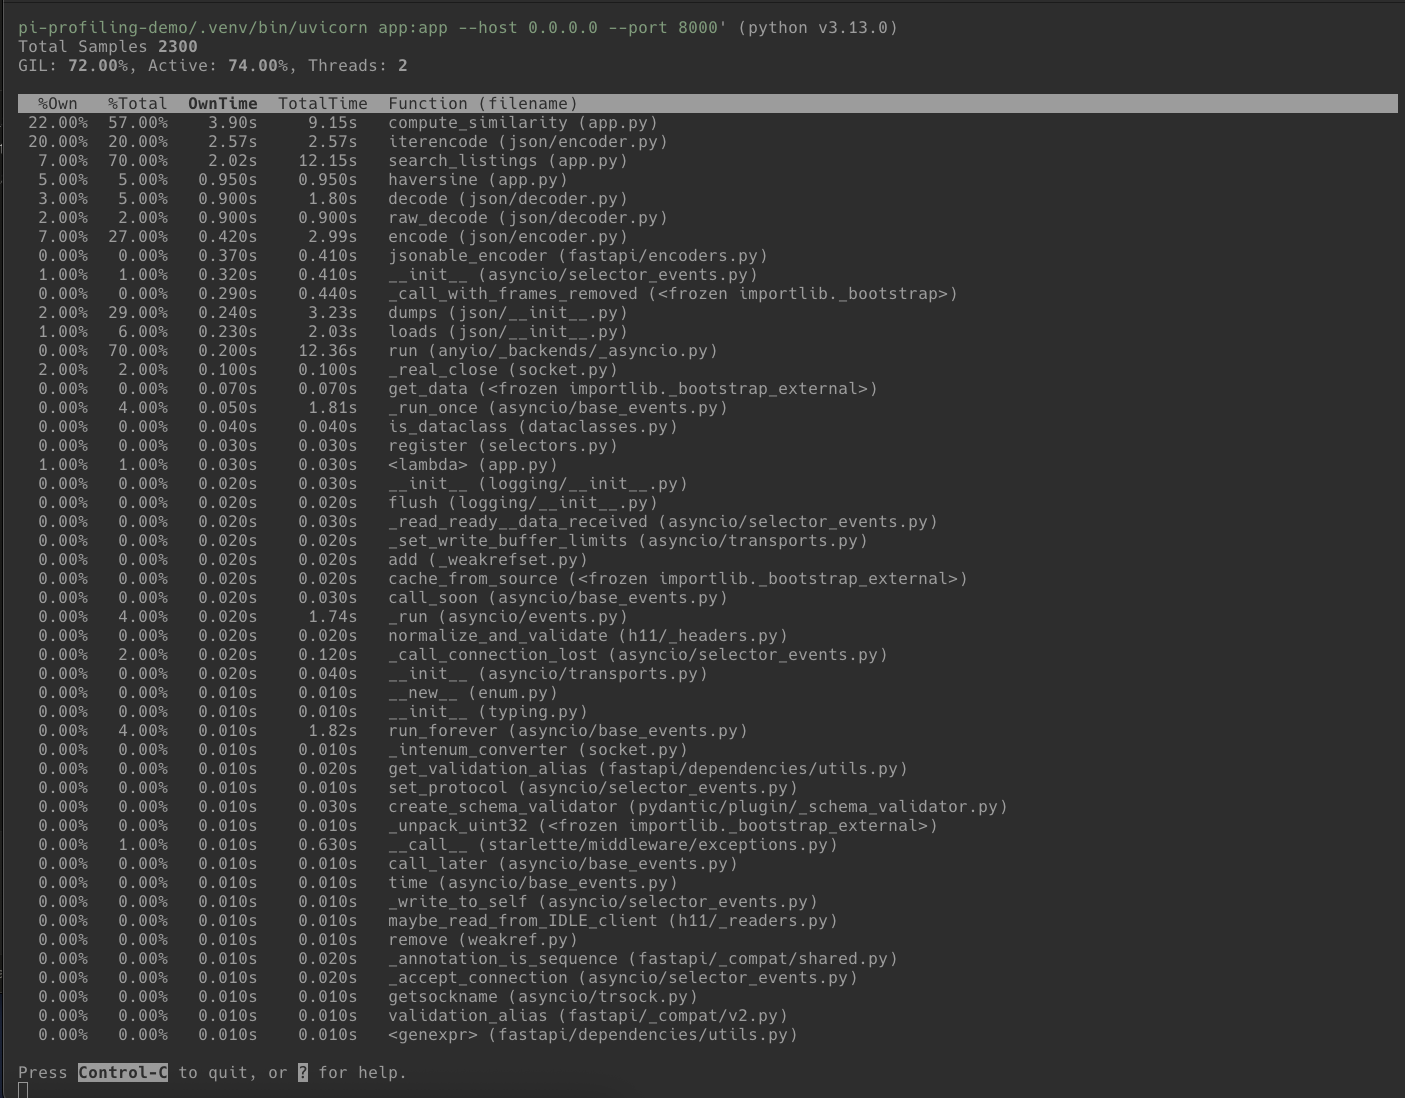
Before generating a full flame graph, py-spy's top command gives you a live, htop-style view:
sudo uv run py-spy top -- uvicorn app:app --host 0.0.0.0 --port 8000This shows you in real-time which functions are consuming CPU while you hit endpoints from another terminal. It's useful for a quick sanity check before committing to a full recording session.
Reading the Flame Graph
Open profile.svg in a browser. You'll see something called a flame graph (technically an icicle graph when the root is at the top, but the terms are used interchangeably).

Here's how to read it:
- Each bar is a function in the call stack.
- Width represents time. A wider bar means the profiler caught that function running in more samples. If a bar spans 40% of the graph width, that function was on the CPU for roughly 40% of the recorded time.
- The vertical axis is stack depth. The topmost bar is the entry point. Bars below are functions called from the bar above. The deepest bars are where the CPU was actually working.
- Width is not a timeline. The x-axis doesn't represent when things happened, only how often.
The SVG is interactive. Click any bar to zoom in. Hover for exact percentages. Use the search button to highlight specific function names.
What the Profile Reveals
In our application, the flame graph will show several things. Click on compute_similarity to zoom in and see the detail:
1. compute_similarity dominates. It's the widest bar under our endpoint handler. Within it, you'll see time split across the nested amenity loop and — critically — the json.dumps / json.loads calls.
2. json.dumps and json.loads appear prominently. This is the pointless serialise/deserialise roundtrip in compute_similarity. It's called once per listing (5,000 times per request). Each call individually is microseconds, but 5,000 of them adds up.
3. The nested amenity loop (for amenity in requested: for listing_amenity in ...) shows up as well. It's O(n*m) where a set lookup would be O(n).
4. haversine is visible but proportionally smaller. The math operations are cheap individually — the issue isn't the formula, it's that everything is called in a Python-level loop over 5,000 items.
Fixing the Bottlenecks
Armed with the flame graph data, we can make targeted fixes instead of guessing.
Fix 1: Remove the JSON Roundtrip
The json.loads(json.dumps(...)) pattern in compute_similarity is pure waste. It was probably added as a "validation" step that never got removed. Delete it (and you can drop the import json at the top of the file — it's no longer needed):
def compute_similarity(listing: dict, preferences: dict) -> float:
    score = 0.0

    price_diff = abs(listing["price_per_night"] - preferences["target_price"])
    score += max(0, 100 - price_diff) / 100

    requested = preferences.get("amenities", [])
    for amenity in requested:
        for listing_amenity in listing["amenities"]:
            if amenity.lower().strip() == listing_amenity.lower().strip():
                score += 1.0

    score += listing["rating"] / 5.0

    if listing["reviews"] > 0:
        score += math.log(listing["reviews"]) / 10

    return score
Fix 2: Replace the Nested Loop with a Set Intersection
The amenity matching loop is O(n*m) and calls .lower().strip() on every comparison. Pre-compute a normalised set once:
def compute_similarity(listing: dict, preferences: dict) -> float:
    score = 0.0

    price_diff = abs(listing["price_per_night"] - preferences["target_price"])
    score += max(0, 100 - price_diff) / 100

    requested = preferences.get("amenities_set", set())
    listing_amenities = set(a.lower().strip() for a in listing["amenities"])
    score += len(requested & listing_amenities)

    score += listing["rating"] / 5.0

    if listing["reviews"] > 0:
        score += math.log(listing["reviews"]) / 10

    return score
And pre-normalise the requested amenities in the endpoint:
@app.get("/listings/search")
def search_listings(
    lat: float = Query(54.55),
    lon: float = Query(-7.28),
    target_price: int = Query(100),
    amenities: str = Query("wifi,parking,kitchen"),
    max_results: int = Query(20),
):
    preferences = {
        "target_price": target_price,
        "amenities_set": set(a.lower().strip() for a in amenities.split(",")),
    }

    results = []
    for listing in LISTINGS:
        distance = haversine(lat, lon, listing["latitude"], listing["longitude"])
        similarity = compute_similarity(listing, preferences)
        results.append({
            "id": listing["id"],
            "name": listing["name"],
            "price_per_night": listing["price_per_night"],
            "similarity_score": round(similarity, 3),
            "distance_km": round(distance, 2),
        })

    results.sort(key=lambda x: x["similarity_score"], reverse=True)
    return results[:max_results]
Fix 3: Pre-normalise Listing Amenities at Startup
Rather than calling .lower().strip() on listing amenities for every single request, do it once when the data loads:
for listing in LISTINGS:
    listing["amenities_set"] = set(a.lower().strip() for a in listing["amenities"])
Then update compute_similarity to use the pre-computed set:
listing_amenities = listing["amenities_set"]
score += len(requested & listing_amenities)
The Result
After these three fixes, profile the application again with py-spy. The flame graph will look fundamentally different. The compute_similarity bar will be dramatically narrower. The json module will disappear entirely. The endpoint that was taking seconds will now respond in tens of milliseconds.

The dominant cost is now FastAPI's own response serialisation (jsonable_encoder) — framework overhead, not your code. That's the signal that you're done optimising.
The specific improvement will depend on your hardware, but we typically see a 10-20x speedup from these kinds of targeted fixes. The point isn't the exact number — it's that py-spy told us exactly where to look instead of guessing.
Py-spy in Production
Earlier we installed py-spy as a dev dependency via uv add --dev py-spy — that works for the launch-and-profile workflow where py-spy starts the process as a child. For production use, where you need to attach to an already-running process, install py-spy as a global tool:
uv tool install py-spy
# or
pipx install py-spy
This puts py-spy on your system PATH so it's available regardless of which project or virtual environment you're in. On Linux, attaching to a process you didn't launch typically requires sudo.
Note that py-spy cannot profile remote processes — it reads process memory directly via OS system calls, so it must run on the same machine as the target Python process. The typical workflow for a remote server is: SSH in, find the PID with pgrep -f uvicorn, attach with sudo py-spy record --pid <PID> -o profile.svg, then copy the SVG back to your local machine for analysis:
scp server:/path/to/profile.svg .
For containerised environments, kubectl exec or docker exec into the container instead.
This is where the --pid workflow lives. For production FastAPI deployments, py-spy really shines because it doesn't require any code changes or restarts.
Profiling Gunicorn/Uvicorn Workers
Most production FastAPI deployments run behind gunicorn with uvicorn workers:
gunicorn app:app -w 4 -k uvicorn.workers.UvicornWorkerProfile the whole tree with:
sudo py-spy record -o profile.svg --pid $(pgrep -f gunicorn | head -1) \
    --subprocesses --duration 60
The --subprocesses flag is critical here. Without it you'll only profile the gunicorn master process, which does almost nothing.
Non-blocking Mode
If you're profiling a production service and can't tolerate even the small overhead of py-spy pausing the process briefly to read memory:
sudo py-spy record -o profile.svg --pid <PID> --nonblockingThis trades a small increase in sampling errors for zero impact on the target process. You may get occasional partial stack frames, but the overall picture remains accurate.
Docker and Kubernetes
In containerised environments, you'll need the SYS_PTRACE capability:
# docker-compose.yml
services:
  api:
    build: .
    cap_add:
      - SYS_PTRACE
For Kubernetes:
securityContext:
  capabilities:
    add:
      - SYS_PTRACE
Then exec into the container and run py-spy as normal. Note that the SYS_PTRACE capability is blocked by both the baseline and restricted Pod Security Standards, so you'll need to consider this in your security posture. Profile in staging, not production, unless you've explicitly approved the capability.
A Note on Async
py-spy profiles CPU time. It shows you which functions are on the CPU when the sampler fires. For a FastAPI application, this means it's excellent at finding CPU-bound bottlenecks — exactly the kind of issues in our example.
What it won't show you is time spent waiting on I/O: database queries, HTTP calls to external services, file reads. If your endpoint is slow because it's waiting on a PostgreSQL query that takes 3 seconds, py-spy will show the process as idle during that time and you won't see a corresponding bar.
For I/O-bound performance issues, you need different tools: OpenTelemetry for distributed tracing, database query logging, or a tool like pyinstrument which has explicit async support and can attribute time spent in await calls.
Use py-spy when you suspect CPU-bound work is the problem. Use distributed tracing when you suspect I/O. In practice, you'll often need both.
Quick Reference
| Command | Use Case |
|---|---|
sudo uv run py-spy record -o profile.svg -- uvicorn app:app | Launch and profile in dev environment |
sudo uv run py-spy top -- uvicorn app:app | Live view of hot functions in dev |
py-spy top --pid <PID> | Live view of running process (requires system-wide install) |
py-spy record -o profile.svg --pid <PID> | Generate flame graph from running process (requires system-wide install) |
py-spy record --format speedscope -o profile.json --pid <PID> | Speedscope format for interactive analysis (requires system-wide install) |
py-spy dump --pid <PID> | Dump current call stacks (requires system-wide install) |
py-spy record --subprocesses --pid <PID> | Profile worker pool (requires system-wide install) |
Wrapping Up
The pattern is always the same. You have a slow endpoint, you think you know where the problem is, and you're wrong. py-spy removes the guesswork. It gives you a flame graph that says "this function consumed 40% of your CPU time" and you go fix that specific function.
For FastAPI applications specifically, the most common bottlenecks we see are: unnecessary serialisation/deserialisation in hot loops, O(n²) algorithms hiding in innocent-looking list operations, repeated string operations that should be pre-computed, and synchronous blocking calls on the event loop.
py-spy finds all of them except the last one. For that, you'll need to add async-aware observability — but that's a different post.